The first half of 2026 presented a private equity landscape defined less by direction than by concentration. While headline figures across the venture capital and private equity asset classes suggested renewed momentum, the more telling story lies beneath them: Overall activity continued to consolidate around the largest managers and transactions.
The ongoing consolidation played out against a volatile macroeconomic backdrop during H1 2026, which itself was a story of two quarters. Public equities sold off in the first quarter after reaching record highs in late January, pressured by a re-rating in software multiples due to AI-related concerns, escalating conflict in the Middle East, and persistent inflation. The equity markets then staged a sharp second-quarter recovery that carried many major indices to fresh all-time highs.
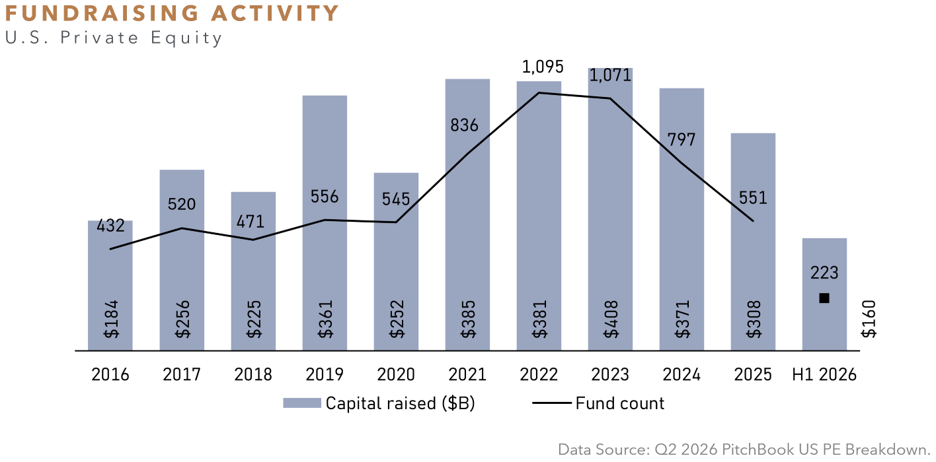
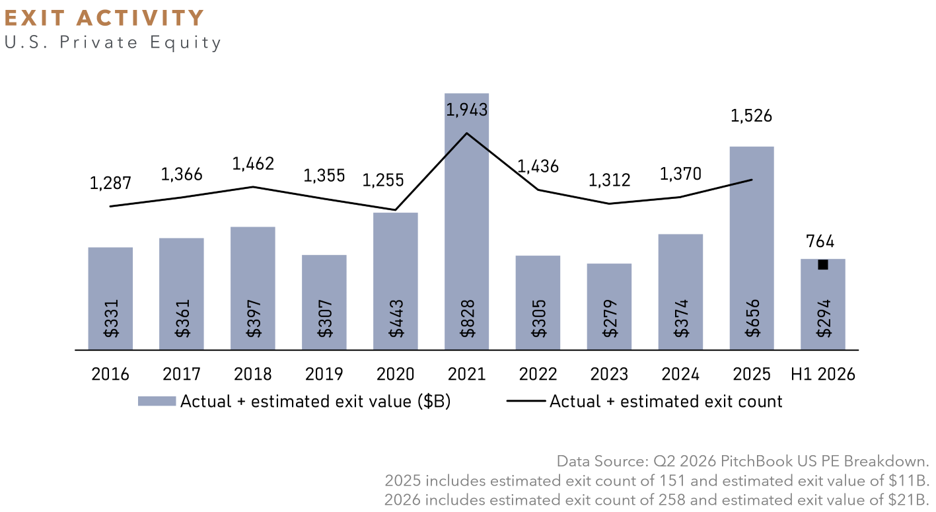
Against this backdrop, U.S. private equity fundraising remained constrained, partly a result of the reported lack of GPs coming to market this year. Nonetheless, capital continued to gravitate toward established managers and mega-funds, while smaller managers captured a shrinking share. Deal activity during H1 held relatively steady, while exit value was dependent on a small number of larger realizations. European private equity followed a similar pattern. Fundraising slowed in the absence of large-cap fund closes, while a rebound in exit value also rested on a handful of sizable transactions rather than broad, market-wide activity.
Venture capital told the most dramatic version of the same story, with record deal and exit values driven overwhelmingly by AI and a single landmark IPO in SpaceX, even as the number of funds raising capital continued to decline. The secondary market, meanwhile, remained the industry’s release valve, posting its most active first half on record as GP-led solutions continued to represent a growing share of overall activity.
The sections that follow examine each market where Abbott focuses in turn. As you’ll note, the throughline is consistent. Capital and liquidity have been flowing, but narrowly — a dynamic we believe puts a premium on manager selection and positioning as we look toward the second half of the year.
VENTURE CAPITAL
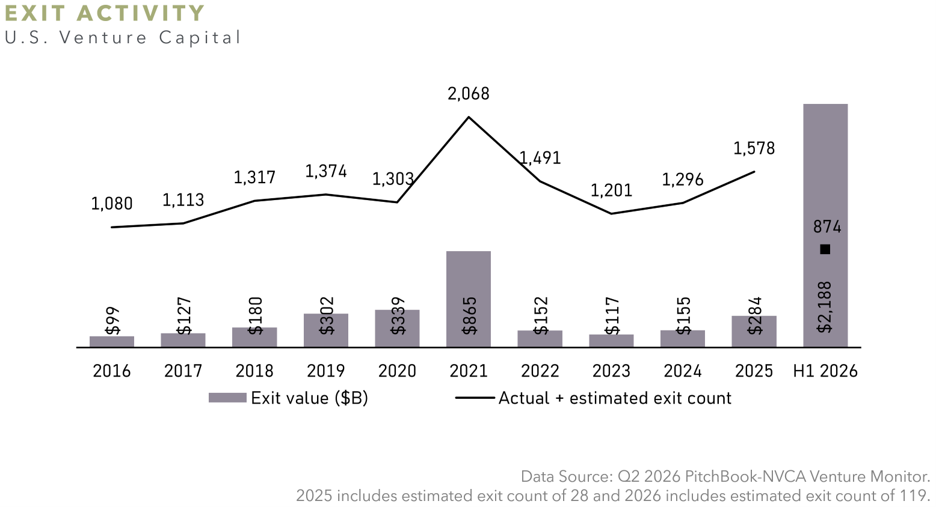
On the surface, the U.S. venture capital market appears to have rebounded in H1 2026. Funds raised more money, and deal and exit activity reached all-time highs. In dollar terms, deals and exits in H1 2026 already exceeded full-year 2025 figures. A closer look at the numbers, however, reveals a market defined by concentration.
Through H1 2026, the U.S. venture capital market raised over $72 billion across 405 funds. Annualized, that figure exceeded each of the prior three years in dollars raised. The number of funds, however, contracted: 2026 is on pace to see the fewest funds raised since 2019. First-time funds account for just 13% of the total fund count, the lowest in over a decade. This is a sign that amid market volatility, investors are favoring established firms.
Deal value through H1 2026 exceeded every prior full year of the past decade. On a deal-count basis, annualized first-half figures are on track to surpass every year in the past decade except 2021, but value outpaced that trajectory by a wide margin. Median pre-money valuations rose across all stages, from pre-seed to venture growth. The sharpest increase came in venture growth, where median pre-money valuations are up 153% in H1 2026 from 2025 and 55% from the previously perceived peak of 2021. AI has increasingly become the largest part of the market, comprising 86% of VC deals by value. For reference, AI accounted for 65% of the market in 2025 and averaged 34% over the prior decade.
Exit value reached a record high of nearly $2.2 trillion for the first half of the year, skewed by SpaceX’s $1.8 trillion IPO, the largest IPO to date. Total exit value exceeded that of the prior six years combined. The number of exits is likewise on pace to exceed every year in the past decade except 2021, but not at the same margin as exit value. With OpenAI and Anthropic having filed confidentially to go public, further massive exits can be expected, though dollar concentration is expected to persist.
U.S. PRIVATE EQUITY
U.S. private equity fundraising remained constrained through the first half of 2026, with $160 billion raised across 223 funds, tracking closely with 2025’s muted full-year total of $308 billion across 551 funds and well below the peak years of 2021 through 2024. While capital raised over the second quarter was a 60% increase over the first quarter, fund counts were essentially flat, and the quarterly jump reflected a handful of large mega-fund closes rather than a genuine broadening of the market. Capital continued to concentrate among the largest, most established managers, with funds under $1 billion drawing just 17% of all capital raised year to date.
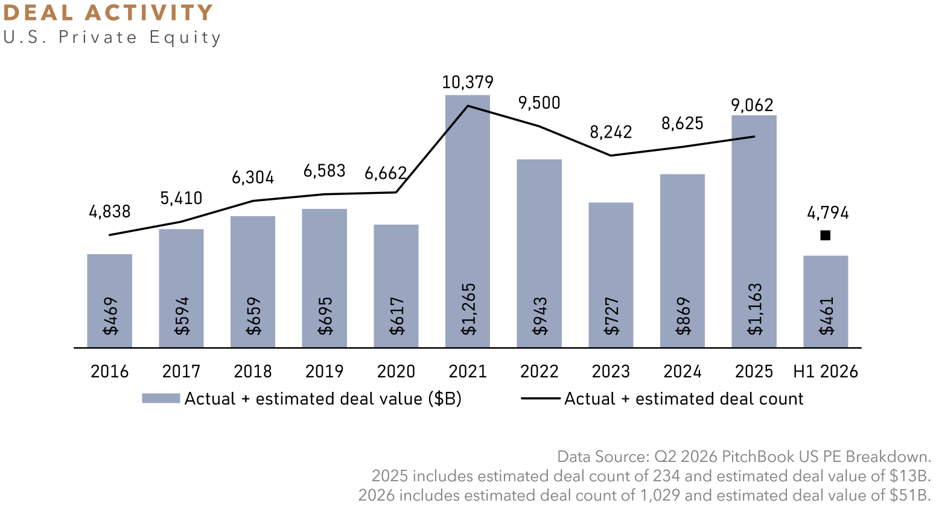
In H1 2026, transaction counts held firm while aggregate value contracted. Deal value totaled $461 billion across 4,794 transactions (includes estimated deal value of $51 billion and deal count of 1,029), representing an 11% decline in deal value compared to H1 2025 even as deal count rose modestly over the same period. Add-ons remained the dominant strategy, comprising 56% of all buyout transactions.
Exit activity remained under a liquidity squeeze in the first half of 2026, with realizations of $294 billion across 764 transactions (includes estimated exit value of $21 billion and exit count of 258) down 14% against the comparable 2025 window. Realizations remained dependent on a small number of larger transactions, with large exits of $1 billion or more representing 77% of the exit value realized. By sector, exits favored B2B, which generated $126 billion of value over the period, up 145% compared to the first half of 2025, while IT and healthcare realizations fell by 77% and 36%, respectively.
EUROPEAN PRIVATE EQUITY
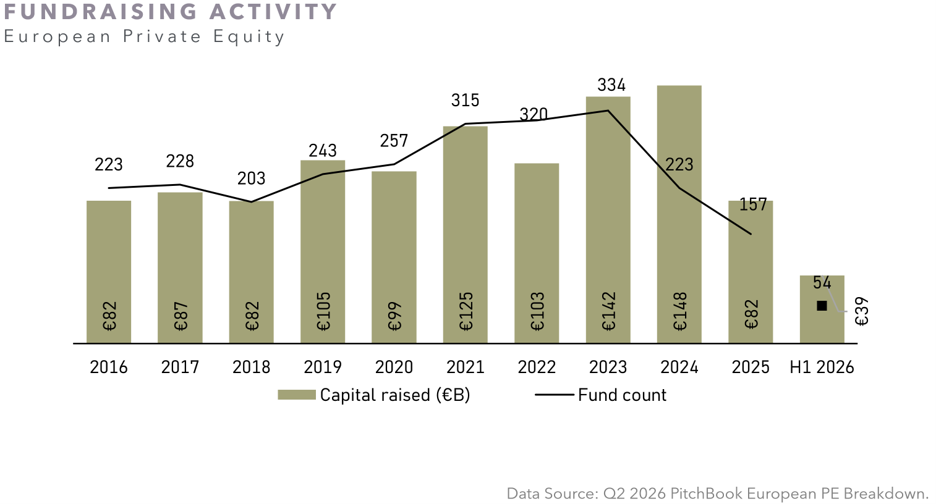
European private equity fundraising in 2026 is on track to come in below the levels of 2025, with €39 billion raised across 54 funds in H1 2026. This represents only 34% of fund count and 48% of volume compared to the 2025 full-year figures. The muted activity, particularly in volume, is partially the result of the lack of large cap funds closing in the first half of 2026. The mid-market segment (which Abbott defines as funds between €1 billion and €5 billion), on the other hand, has continued its strong momentum, with 54% of the amount raised in H1 2026 coming from this segment. We expect the mid-market to continue to have a strong second half of 2026, with several European mid-market managers in the market or preparing to launch after the summer, but we also expect a partial recovery of the large cap market with managers such as Advent and CVC expected to raise significant amounts of capital over the coming quarters.
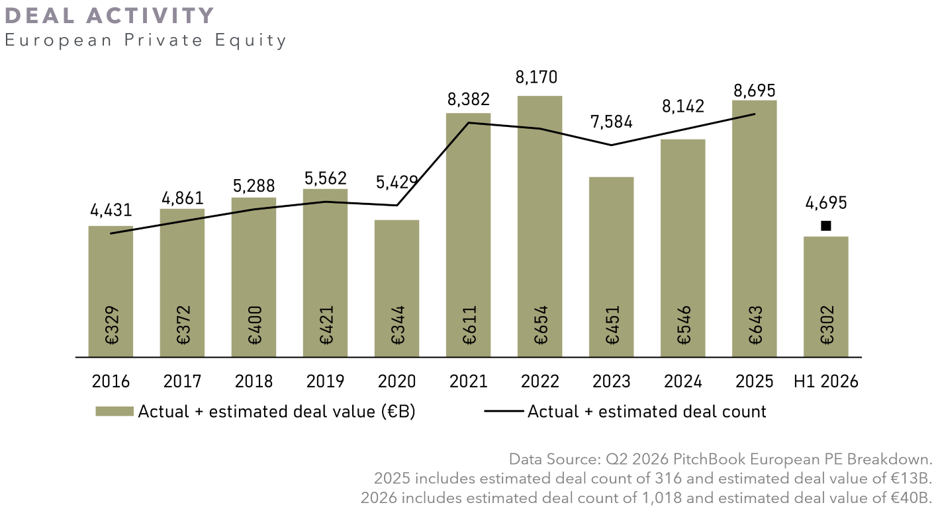
Deal value in H1 2026 was slightly up compared to H1 2025, with €302 billion deal value closing (includes estimated deal value of €40 billion), marking an increase of 8% year-over-year. Deal count was also up by 12% over the same period (includes estimated deal count of 1,018). The outlook for the remainder of 2026 is somewhat more uncertain. Continuing conflicts in the Middle East and potential risk of resurging inflationary pressures raise the prospect of more interest rate increases by central banks in H2 2026.
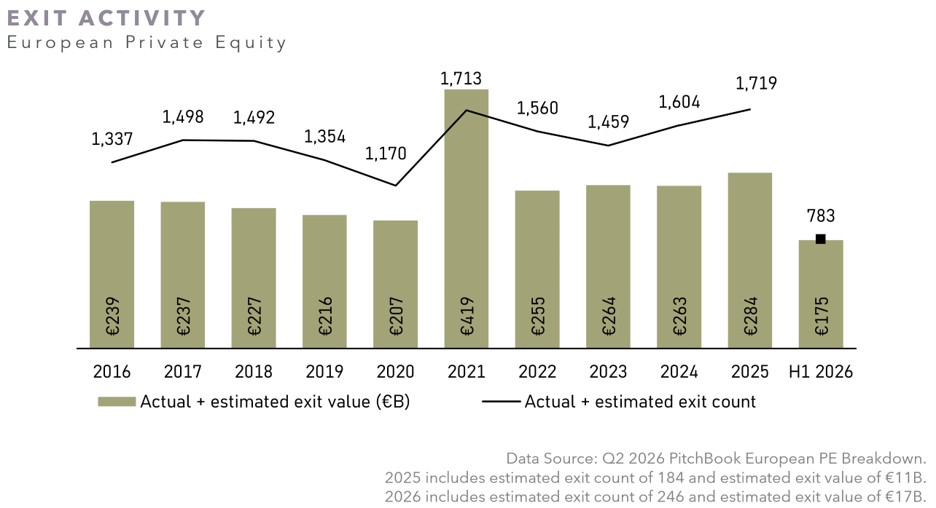
With respect to realizations, activity rebounded somewhat in H1 2026 compared to H1 2025 with exit value up 59% year-over-year but exit count only slightly up 5% over the same period. This trend is the result of 12 larger company exits of €2.5 billion or greater making up 56% of exit value and therefore may not be a harbinger of a broader exit market recovery.
SECONDARIES
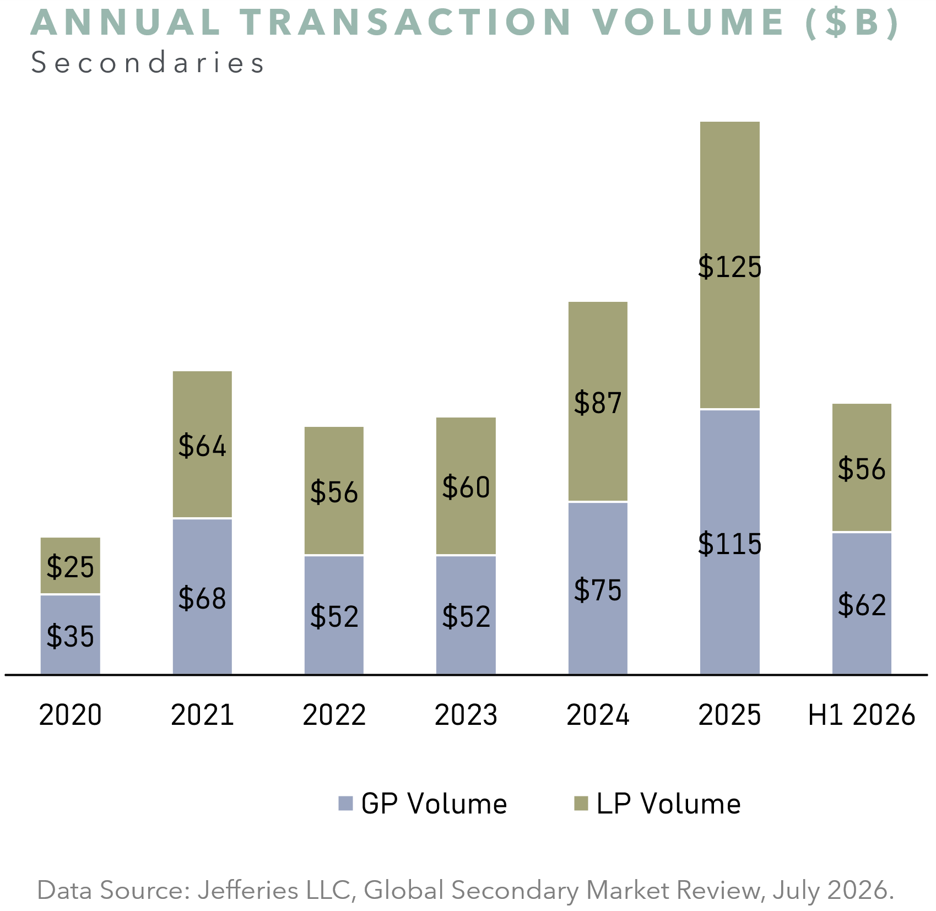
Global secondary market volume of $118 billion in H1 2026 was the most active first half in history, representing a 15% increase from the $103 billion of volume in H1 2025. Per Jefferies, growth was achieved despite a backdrop of geopolitical uncertainty and software valuation pressure from AI, underscoring the secondary market’s resilience. GP-led transactions represented a slight majority of activity at 53% of total volume, marking the first time since 2021 that GP-led volume has outpaced LP volume.
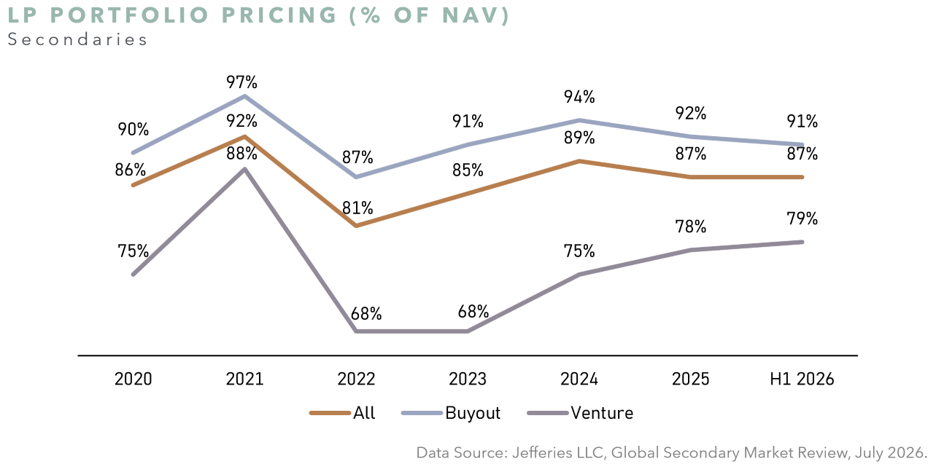
On the LP side, which represented 47% of volume at $56 billion, sellers were motivated to generate liquidity as they experienced a persistent lack of distributions. Pensions and sovereign wealth funds remained the largest source of LP secondary supply at 48% of volume, while endowments and foundations accounted for 16% of volume, consistent with H1 2025 trends. LP secondary market pricing held steady in the first half of the year, with average pricing across all strategies flat to 2025 at 87% of NAV. Buyout pricing remained strong at 91% of NAV while venture rose 100 bps to 79% of NAV. Per Jefferies, venture pricing showed bifurcation with buyers paying a premium for AI assets, offset by softer pricing for pure SaaS portfolios. In general, buyer demand focused on quality, demonstrating strong pricing for diversified portfolios with high-quality assets and limited software exposure. This enabled the LP market to absorb several large transactions, including a record five deals over $2 billion.
GP-led transactions grew substantially in H1 2026 to $62 billion, a 32% increase in volume over the $47 billion reported in H1 2025. Continuation vehicles remained the dominant structure, accounting for approximately 89% of GP-led volume, with single-asset CVs making up 68% of total CV volume. Buyouts remained the largest strategy within the GP-led market at 66% of volume. As the GP-led market matures, it continues to represent a growing share of overall exit activity, with CV exits equal to approximately 14% of global sponsor-backed exit volume, up from just 5% in 2020. As of H1 2026, Jefferies estimates that 82 of the top 100 global sponsors by AUM have executed a continuation vehicle. Europe also continued to build scale, with the region’s GP-led market reaching approximately $15 billion, or 24% of global GP-led volume.
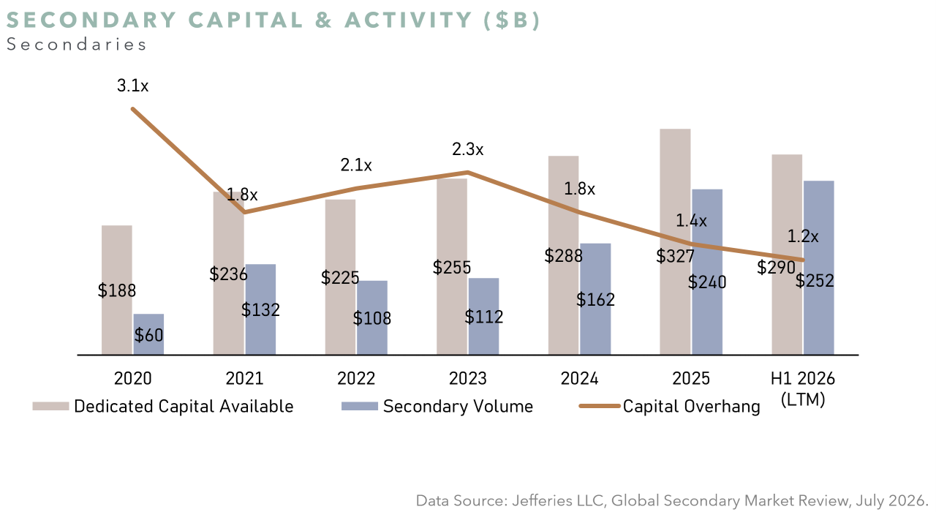
Dedicated available secondary capital totaled $290 billion at the end of H1 2026 (LTM), down from the record $327 billion reported at year-end 2025, as elevated deployment across both LP- and GP-led transactions outpaced fundraising. Even so, the market remained well capitalized, with a capital overhang of 1.2x, down slightly from 1.4x in the prior year. Looking ahead, Jefferies expects full-year 2026 volume of approximately $260 billion, exceeding the record $240 billion achieved in 2025.
ADDITIONAL CHARTS
Sources and Important Information
SOURCES Unless otherwise noted, with respect to private equity information, data sourced through: Q2 2026 PitchBook US PE Breakdown and Q2 2026 PitchBook European PE Breakdown. Unless otherwise noted, with respect to venture capital information, data sourced through: Q2 2026 PitchBook-NVCA Venture Monitor. Unless otherwise noted, with respect to secondaries information, data sourced through: Jefferies LLC, Global Secondary Market Review, July 2026.
This material is for informational purposes only and is not an offer or a solicitation to subscribe to any fund and does not constitute investment, legal, regulatory, business, tax, financial, accounting or other advice or a recommendation regarding any securities of Abbott, of any fund or vehicle managed by Abbott, or of any other issuer of securities. No representation or warranty, express or implied, is given as to the accuracy, fairness, correctness or completeness of third party sourced data or opinions contained herein and no liability (in negligence or otherwise) is accepted by Abbott for any loss howsoever arising, directly or indirectly, from any use of this document or its contents, or otherwise arising in connection with the provision of such third-party data.