Liminality is the state of existing between two clear spaces or phases. Dusk and dawn are liminal times. The security line at the airport is a liminal experience. The canvas vestibule shielding a restaurant’s door in winter is a liminal space, as is the narthex of a church. A liminal state existed between Bear Stearns’ failure in March 2008 and Lehman’s collapse six months later. And the time between the iPhone’s release in 2007 and its clear market dominance over Blackberry in 2011 was a liminal time.
The transition from a cold street to a warm and inviting restaurant is a welcome, and predictable, experience. Sometimes, though, liminal times are unfamiliar and unsettling. One might be aware of a transition, but unsure what is around the corner. What was once a given no longer is.
Investors occupy liminal periods all the time. They thrive in the in-between, and, with skill and foresight, can profit from it. We are in a liminal period right now as it relates to AI. The markets took a dim view of how disruptive AI would be when they wiped hundreds of billions of dollars from the market caps of leading SaaS businesses in February. Salesforce opened the year at $254 and closed the quarter at $185 per share. Is Salesforce 25% less attractive than it was in January? Is every SaaS business? Have the rules changed SaaS valuations completely?
And away from software, are other rules changing? The price of oil increased almost 80% in the first quarter, inflation rose somewhat, and yet GDP continued to grow. While stock markets were mostly down for the first quarter, they shrugged it off quickly and were above water for the year by mid-April.
You’ll read below that venture capital and private equity are in a liminal time. Signals are mixed. Fundraising and investing in venture capital are up, but the increased dollars are flowing to fewer funds and companies. Exits remain challenged. In U.S. and European private equity, more deals are getting done, but less money is being put to work.
VENTURE CAPITAL
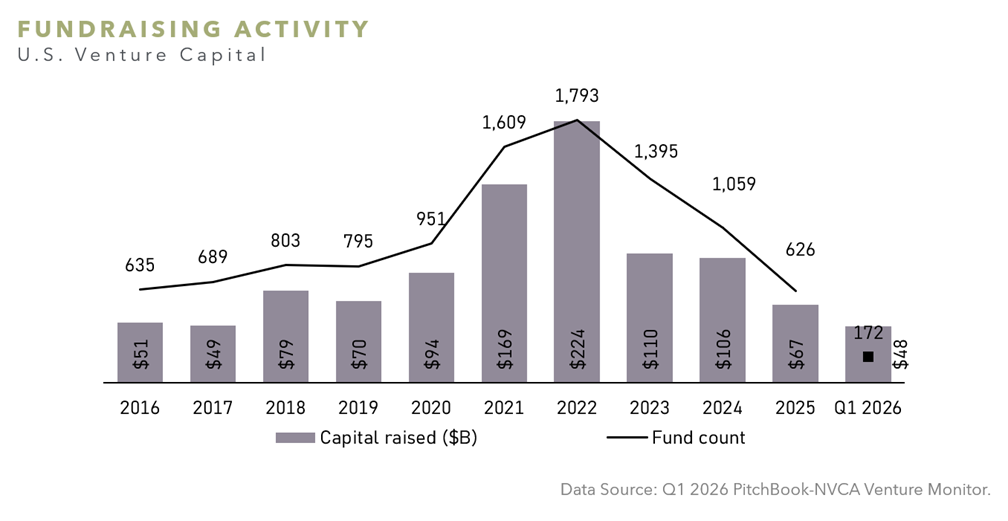
More than 170 U.S. venture capital funds reported raising capital in Q1 2026, slightly ahead of last year’s pace, but well below the pace for the seven prior years. The total capital raised, however, at nearly $48 billion was more than 70% of the entire amount raised in all of 2025.
Those fundraising dollars were highly concentrated, as just five funds collected 73% of all dollars raised.
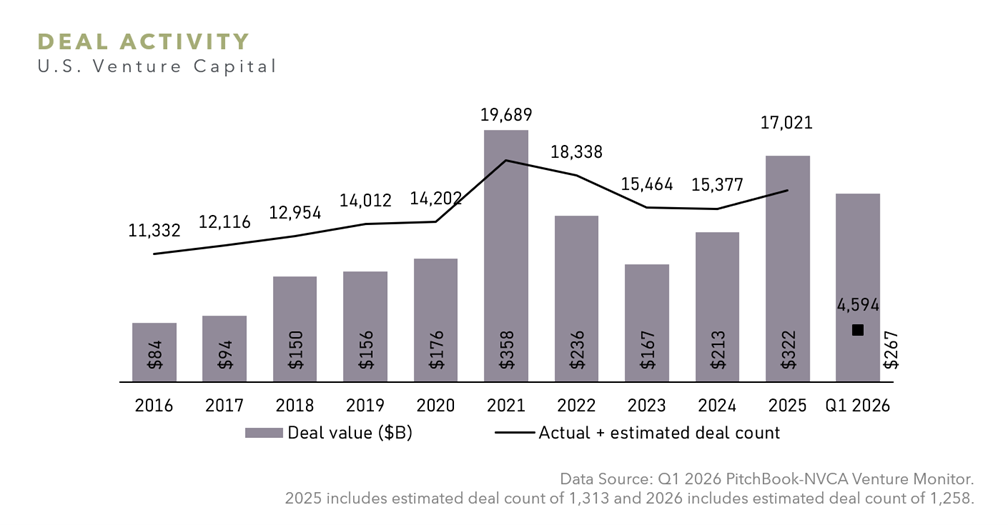
Venture capital deal count of 4,594 in Q1 2026 (includes an estimated deal count of 1,258) was on pace to exceed the average annual deal count over the past decade. Astonishingly, a total deal value of $267 billion for the first quarter has already exceeded the previous decade’s annual average.
Deal value was driven by four $15 billion or larger deals, further highlighting the concentration of capital across the market. A disproportionate amount of capital is, unsurprisingly, flowing to AI and ML companies, which received 89% of U.S. venture capital dollars in the quarter, while comprising only 42% of deals.
Mega-rounds ($100 million or larger deal value) represented 91% of total deal value in the market, up from 67% in 2025, and, on average, 47% the prior nine years.
The median pre-money valuation for deals at all stages rose in the quarter, with Series D and later increasing the most versus 2025 (182%).
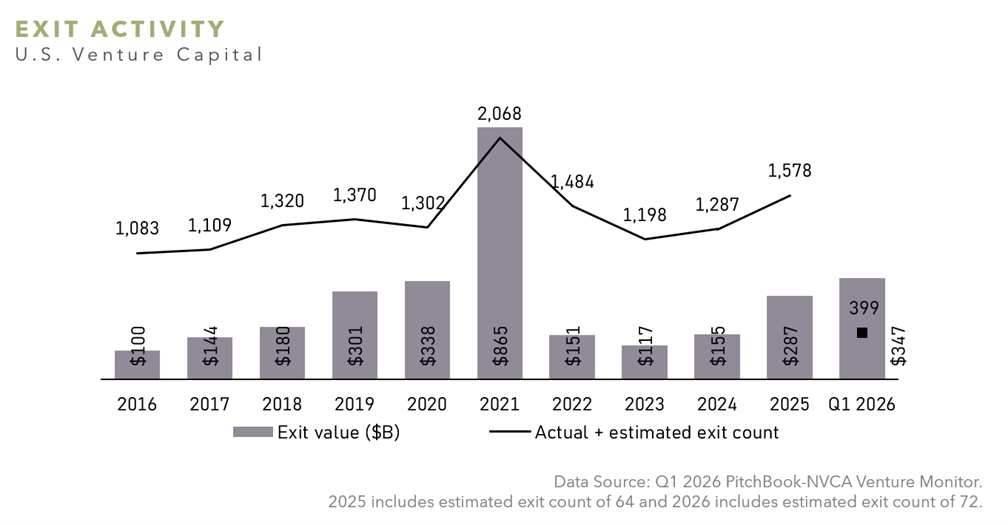
Exit activity in Q1 2026 was $347 billion, the largest quarterly exit value in the past decade. Similar to deal activity, exit activity was concentrated, with the notable $250 billion sale of xAI to SpaceX representing 72% of exit value for the quarter.
U.S. PRIVATE EQUITY
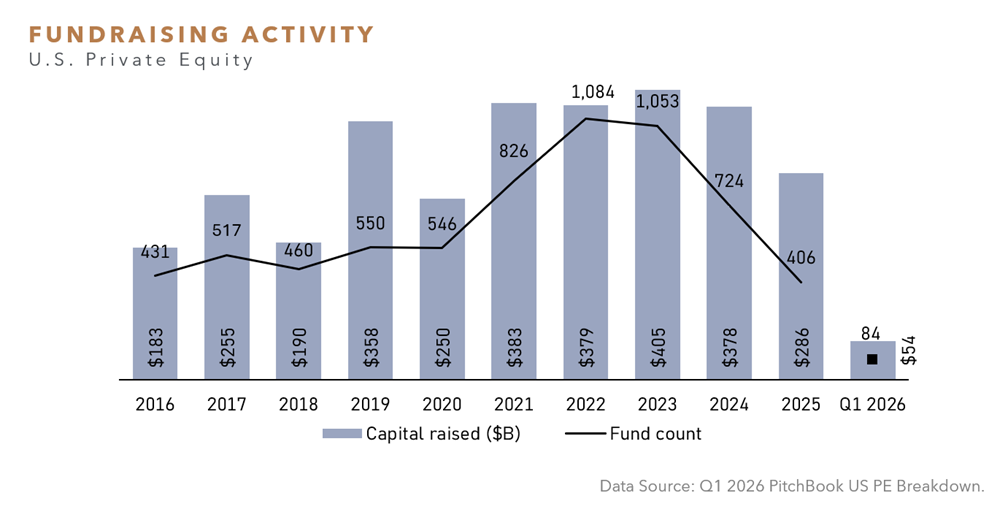
U.S. private equity fundraising remained subdued in Q1 2026, with $54 billion raised across 84 funds.
Capital formation continued to concentrate around larger and established managers, with the 10 largest funds accounting for $35 billion or 64% of the total capital raised during the quarter.
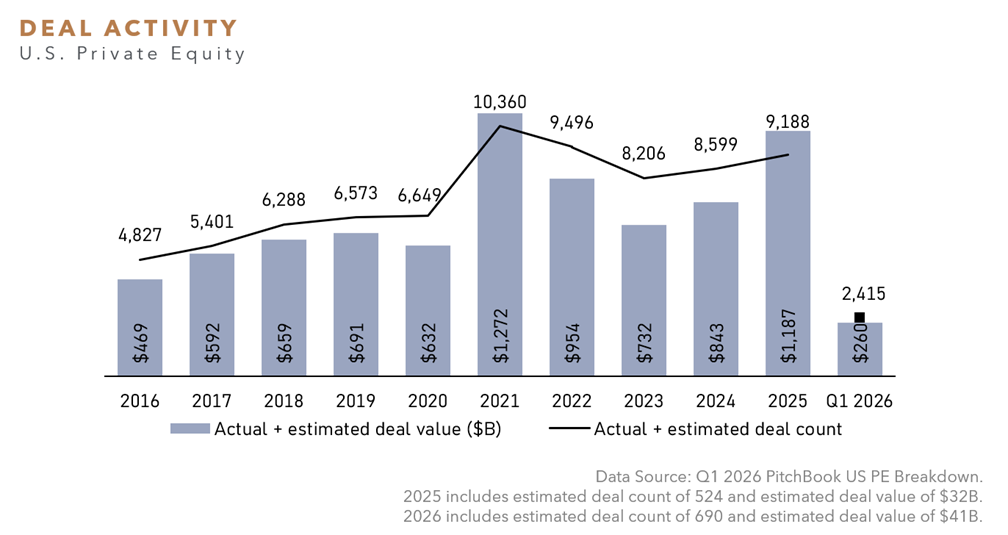
Dealmaking activity remained active by count but softer by value, with $260 billion in deal value reported across 2,415 transactions (includes an estimated deal value of $41 billion and deal count of 690 in Q1 2026).
This represents a 6% increase in volume compared to Q1 2025, though deal value declined 7% year-over-year.
The divergence in deal count and value may suggest that PE managers have continued a shift down market during the quarter, deploying less capital across a larger number of transactions.
Median EV/EBITDA multiples increased modestly to 11.9x in Q1 2026 over the TTM, though valuations remained below 2024’s 13.4x level.
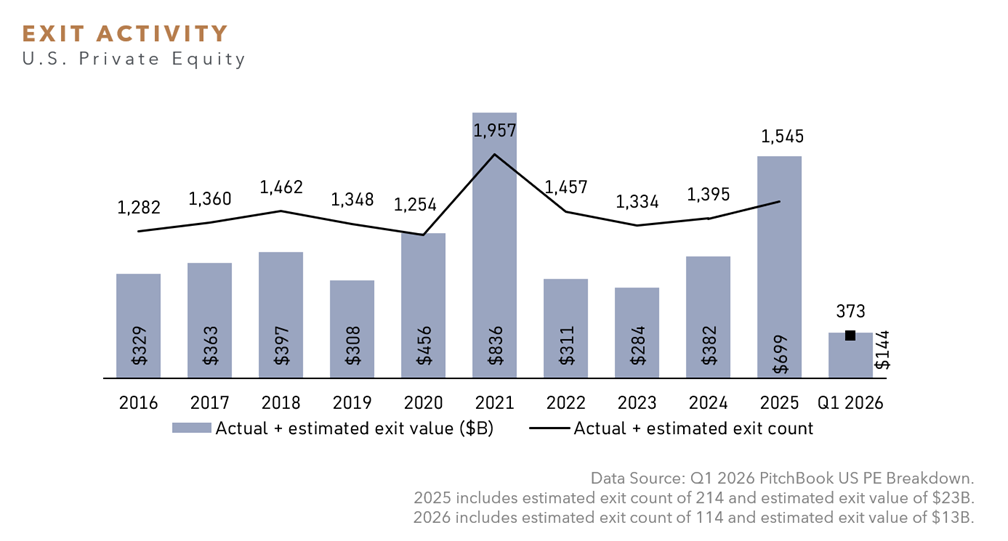
Exit activity pulled back in Q1 2026, with $144 billion in exit value recorded across 373 transactions (includes an estimated exit value of $13 billion and exit count of 114), representing a 35% decrease in value and a 3% increase in count compared to Q1 2025.
EUROPEAN PRIVATE EQUITY
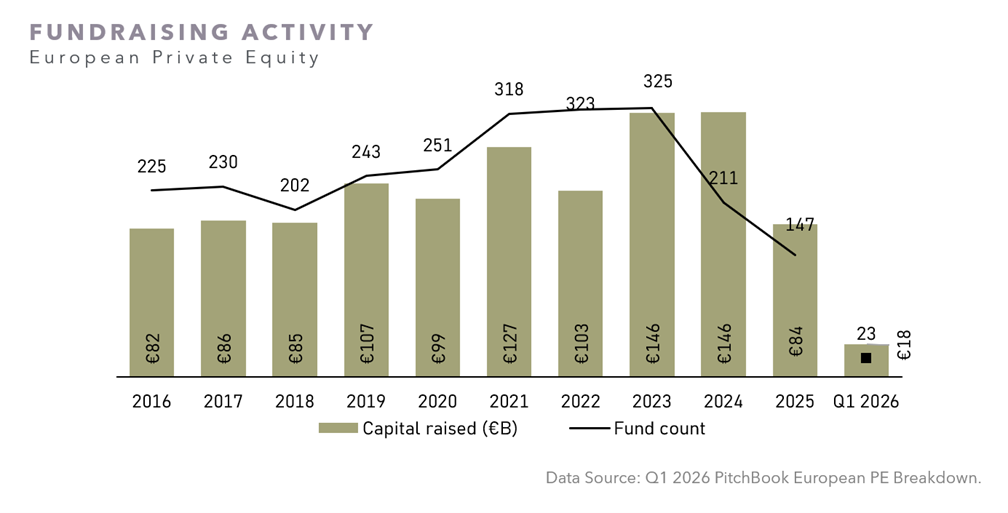
European fundraising activity continued to decline, reaching €18 billion in commitments in Q1 2026 across 23 funds, representing a 24% decrease from the Q1 2025 figure of €24 billion. Funds greater than €1 billion accounted for 71% of the total capital raised, although mega-funds (€5 billion or larger fund size), have continued to decline in count.
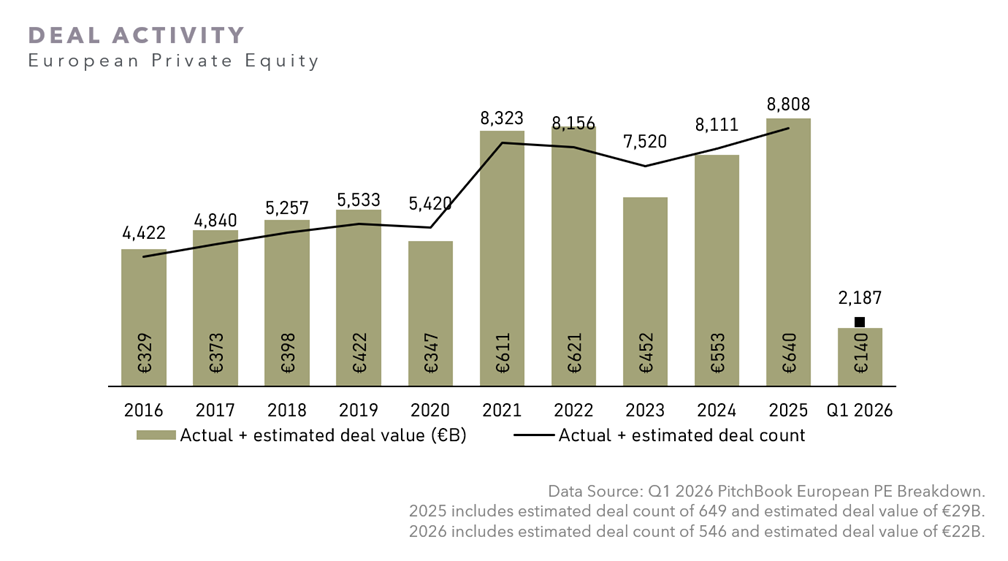
European deal value in Q1 2026 was down 9% compared to Q1 2025, totaling €140 billion, while year-over-year deal count was up 4% across 2,187 deals (includes an estimated deal value of €22 billion and deal count of 546).
Quarter-over-quarter deal value declined 23% and deal count declined 12% (includes an estimated deal value of €16 billion and deal count of 360 in Q4 2025).
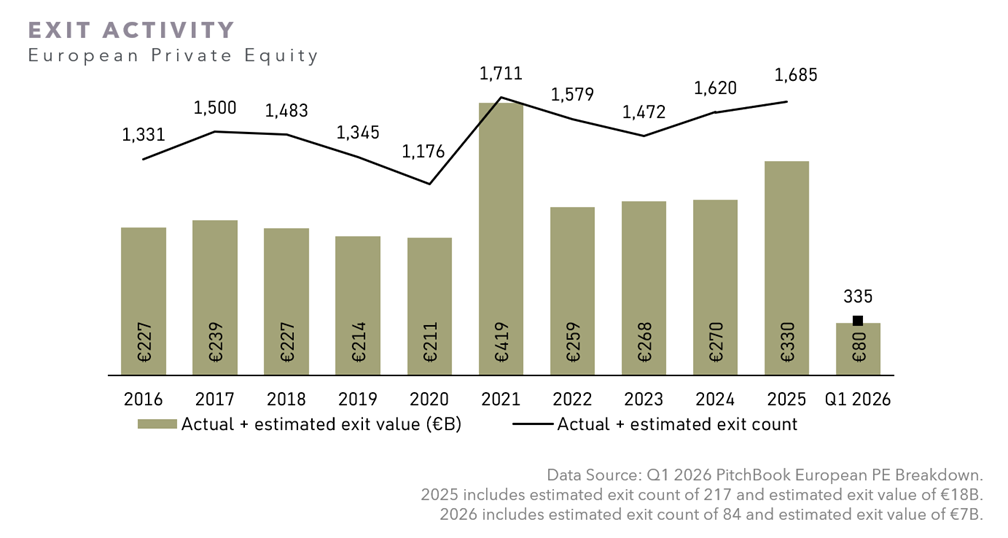
European exit activity in Q1 2026 was up 34% year over year in terms of value and down 10% in terms of count (includes an estimated exit count of 84 and exit value of €7 billion), with mega-deals (€2.5 billion or larger round size) representing the majority share of exit value at 53%.
Quarter-over-quarter exit value declined by 10% and exit count declined by 31% (includes an estimated exit value of €9 billion and exit count of 106 in Q4 2025).
SECONDARIES
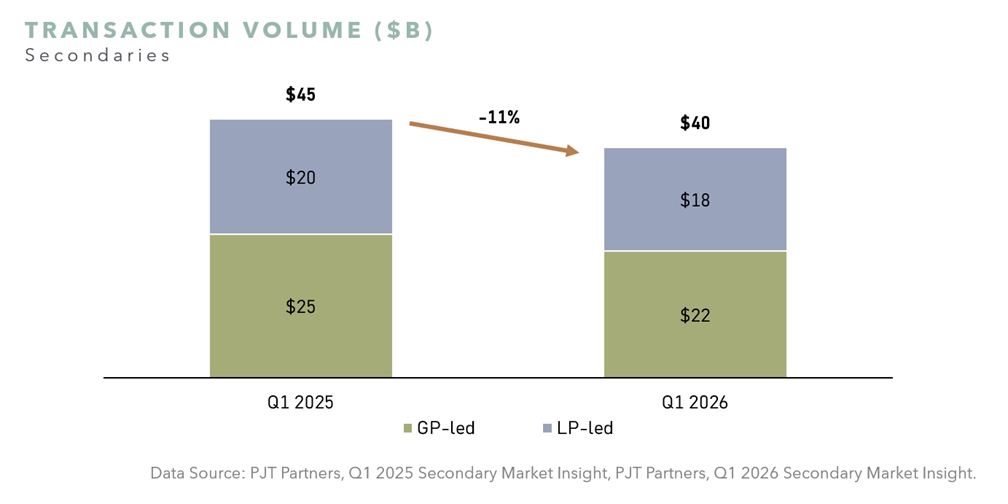
Global secondary deal volume saw a more measured start to the year relative to Q1 2025, with PJT Partners estimating $40 billion of transaction volume in Q1 2026 compared to $45 billion in Q1 2025. This modest decline is attributed to macroeconomic volatility experienced in Q1 2026, namely geopolitical and AI/software market uncertainties.
Prices remained stable for buyout portfolios while venture portfolio pricing experienced a decline in Q1 2026. Per PJT, this was a result of secondary buyers re-underwriting the risks associated with AI and software.
In Q1 2026, buyout portfolios were priced at an average 92% of NAV compared to 93% in Q4 2025. This is consistent with historical pricing, as PJT estimates the 5-year average of buyout portfolios to be 91%.
Venture portfolios experienced more of a decline, pricing at an average 72% of NAV compared to 75% in Q4 2025. This continues to lag the 5-year average, which PJT estimates to be 72%.
ADDITIONAL CHARTS
Sources and Important Information
SOURCES
Unless otherwise noted, with respect to private equity information, data sourced through: Q1 2026 PitchBook US PE Breakdown, Q1 2026 PitchBook European PE Breakdown, and Q1 2025 PitchBook European PE Breakdown.
Unless otherwise noted, with respect to venture capital information, data sourced through: Q1 2026 PitchBook-NVCA Venture Monitor.
Unless otherwise noted, with respect to secondaries information, data sourced through: PJT Partners Q1 2026 Secondary Market Insight, April 2026 and PJT Partners Secondary Invest Roadmap Series FY 2025, January 2026.
IMPORTANT INFORMATION
Past performance is not a guide to future results and is not indicative of expected realized returns.
The views and information provided are as of May 2026 unless otherwise indicated and are subject to frequent change, update, revision, verification and amendment, materially or otherwise, without notice, as market or other conditions change. There can be no assurance that terms and trends described herein will continue or that forecasts are accurate. Certain statements contained herein are statements of future expectations or forward-looking statements that are based on Abbott’s views and assumptions as of the date hereof and involve known and unknown risks and uncertainties (including those discussed below and in Abbott’s Form ADV Part 2A, available on the SEC’s website at www.adviserinfo.sec.gov) that could cause actual results, performance or events to differ materially and adversely from what has been expressed or implied in such statements. Forward-looking statements may be identified by context or words such as “may, will, should, expects, plans, intends, anticipates, believes, estimates, predicts, potential or continue” and other similar expressions. Neither Abbott, its affiliates, nor any of Abbott’s or its affiliates’ respective advisers, members, directors, officers, partners, agents, representatives or employees or any other person is under any obligation to update or keep current the information contained in this document.
This material is for informational purposes only and is not an offer or a solicitation to subscribe to any fund and does not constitute investment, legal, regulatory, business, tax, financial, accounting or other advice or a recommendation regarding any securities of Abbott, of any fund or vehicle managed by Abbott, or of any other issuer of securities. No representation or warranty, express or implied, is given as to the accuracy, fairness, correctness or completeness of third-party sourced data or opinions contained herein and no liability (in negligence or otherwise) is accepted by Abbott for any loss howsoever arising, directly or indirectly, from any use of this document or its contents, or otherwise arising in connection with the provision of such third-party data.