Despite some headline-grabbing events, such as Q2 2025 Liberation Day trade announcements or the Q4 2025 record-setting government shutdown, public and private markets exhibited resilience to conclude 2025. U.S. private equity and venture capital deal value, as well as European private equity, extended their recovery from 2023 lows. Secondaries’ 2025 transaction volume reached new heights, exceeding the prior year’s total by nearly 50%. There are many nuances at play beneath 2025’s top-line figures. U.S. buyout megadeals ($1 billion or greater) accounted for their largest share of deal count since at least 2011; in venture capital, almost 40% of all investments were classified as those in artificial intelligence (“AI”). The concentration in buyout megadeals and AI could, respectively, reflect historically elevated dry powder above the $1 trillion mark on the one hand, and investors’ enthusiasm for innovative, high-growth technologies on the other.
Fundraising, however, sagged across the market with the exception of Secondaries. Venture capital dollars raised in 2025 were approximately one-third lower than the 10-year average and the U.S. private equity tally was its smallest since the pandemic-afflicted 2020 total. European private equity fundraising fell to €81 billion, albeit after a record €147 billion in 2024. One possible factor behind the sluggish fundraising environment could be lagging distributions that have resulted in a buildup of value concentrated in LPs’ private markets’ portfolios, thereby limiting investors’ capacity to allocate to new vintages. Capital formation for the three strategies (U.S. private equity and venture capital, European private equity) appears to have been characterized by the concentration of LPs’ allocations to more established managers.
While private equity and venture capital continued a multi-year rebound, public markets were also buoyed as seen by the S&P 500 and NASDAQ’s respective 2025 gains of 16.4% and 20.4%. The IPO window has cracked open for new issuances across the venture and buyout landscape. For example, Medline’s mid-December 2025 IPO was the largest private equity-backed listing in history. The Federal Reserve advanced looser monetary policy with three quarter-point cuts to the Federal Funds Rate, attempting to balance its dual mandate between diminished but above-target inflation and emergent labor market worries. Investors of all stripes will likely be keen to scrutinize the policies of a new Fed Chair who is expected to be installed in mid-2026.
VENTURE CAPITAL
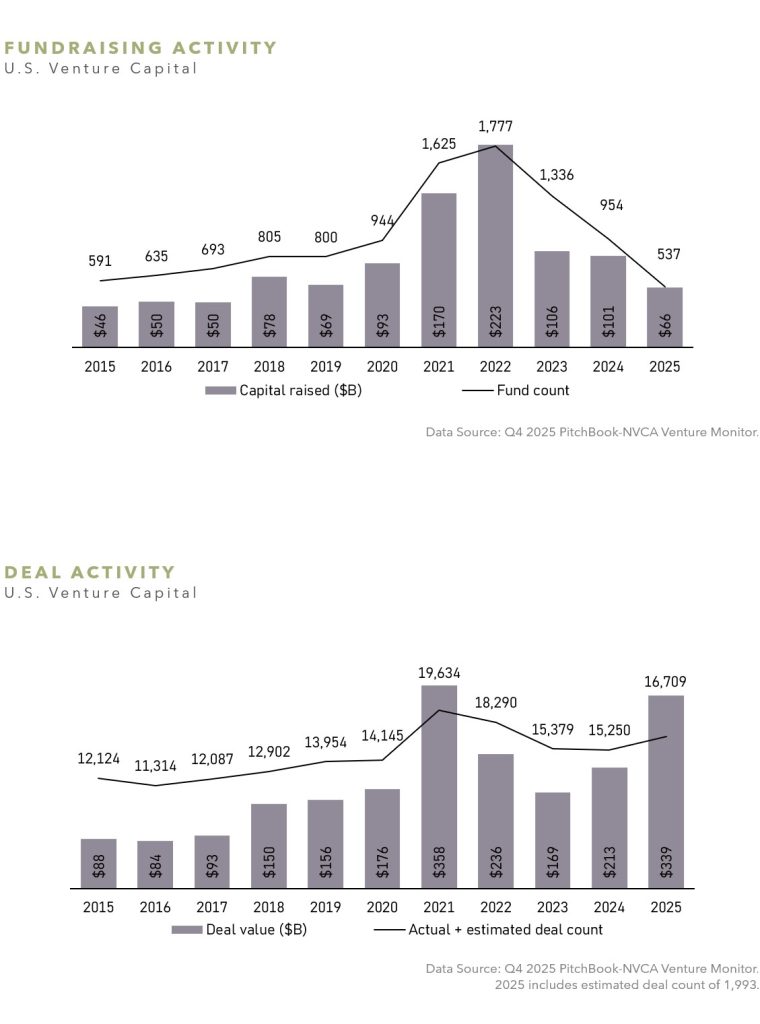
Fewer U.S. venture capital funds were raised in 2025 than in any year in the past decade, according to NVCA’s preliminary estimates. Just 537 funds held a final close during the year versus the 10-year average of 1,016, and fundraising totaled just $66 billion, well below the 10-year average and median of $99 billion and $85 billion, respectively. Fundraising contracted across all fund sizes, and only 29 funds closed with over $500 million. Furthermore, the average fundraising period extended to 18 months in 2025, reaching longest period in over a decade. Emerging managers, (defined by PitchBook as firms that have launched fewer than four funds) represented 44% of funds that held a final close during the year, but they collected only $17 billion, which is the fewest dollars raised in a decade. It appears LPs have continued to concentrate their attention and commitments into more established groups.
Deal count, on the other hand, exceeded 2024 by 10%, while total deal value increased by 59% (2025 includes estimated deal count of 1,993). Although deal count is still 15% below the decade-high figure in 2021, deal value is only 5% lower. Both increases for the year were driven by deals over $50 million, which were up 27% year over year in number and 84% in value. Remarkably, half of the total deal value for 2025 was concentrated in less than 1% of the funding rounds. Since 2023, median pre-money valuations have continued to climb across all series of investments.
Most of the growth in deal count came from early-stage and venture-growth, where the number of deals were up 24% and 20%, respectively. Unsurprisingly, a disproportionate amount of deal activity was focused on AI and machine learning, which attracted 65% of total dollars and 39% of total deals.
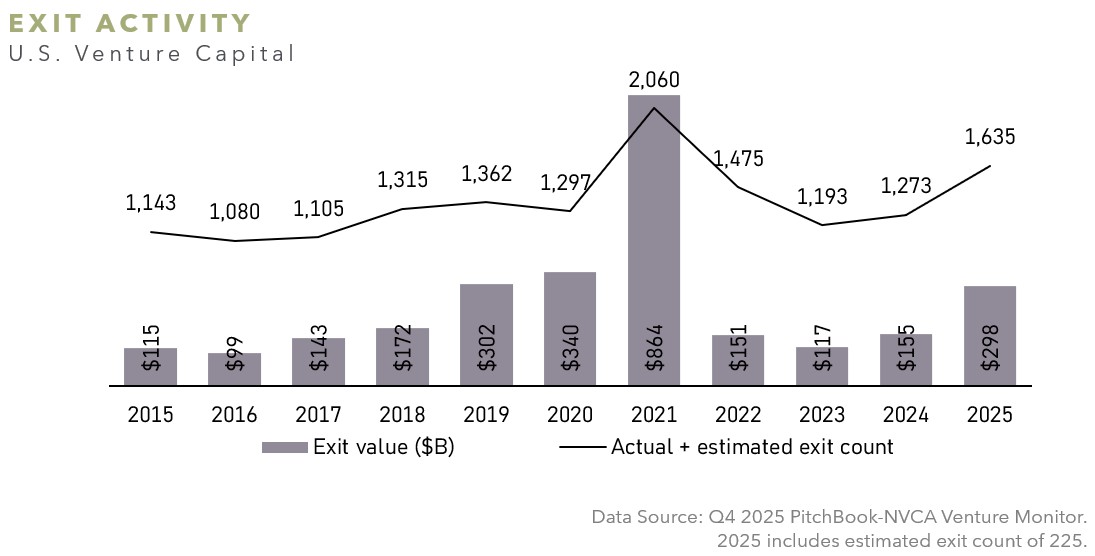
In sharp contrast to the fundraising environment, exit activity rebounded. Total disclosed exit value in 2025 rose 93% from 2024, while the exit count increased 28%, with most exits in the over $500 million size segment (2025 includes estimated exit count of 225). Aside from 2021 highs, 2025 exceeded every other year in the prior decade in terms of exit count. The public markets were more accommodating as an exit alternative in 2025, as the total number of venture-backed IPOs exceeded each of the prior three years.
U.S. PRIVATE EQUITY
U.S. private equity fundraising weakened in 2025, marking the slowest year for capital formation since 2020. Total commitments fell to $278 billion across 327 funds, down from $382 billion in 2024, as LP capital availability remained constrained and fundraising timelines continued to stretch. Similar to recent years, capital formation was increasingly concentrated among larger, more established managers, while the number of funds reaching a final close declined further.
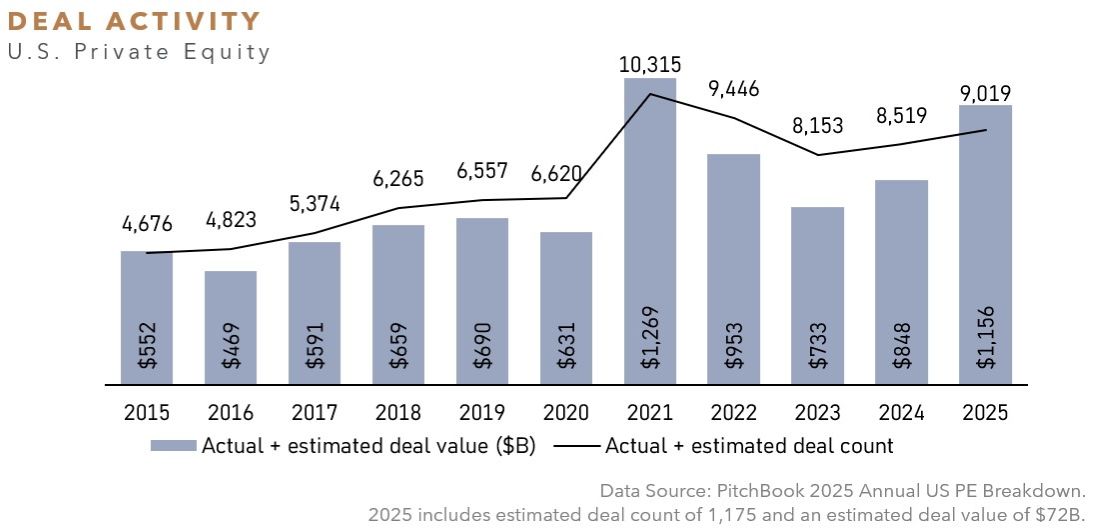
In contrast to subdued fundraising conditions, deal activity rebounded sharply during 2025. Managers completed nearly $1.2 trillion of deal value across 9,019 transactions, representing a 36% increase in deal value from 2024 and placing 2025 among the most active years on record outside of the 2021 peak of $1.3 trillion (2025 includes estimated deal value of $72 billion and deal count of 1,175). Improved financing conditions, tighter credit spreads, and renewed risk appetite supported a resurgence in large-scale transactions, with megadeals ($1 billion or greater) accounting for 52% of total value. Valuations modestly decreased as the year progressed, with median U.S. buyout EV / EBITDA multiples declining to 11.2x from 13.5x in 2024.
These developments carried through to exits as well, as private equity realizations accelerated in 2025 following several muted years. Exit value rose to $728 billion across 1,619 transactions, a 90% increase in value from 2024 and ranking as the strongest year since 2021 (2025 includes estimated exit value of $46 billion and exit count of 418). Exit activity was heavily skewed toward larger outcomes, with megadeals accounting for 78% of total value, while IPO exits also reemerged as a meaningful, though still episodic, liquidity pathway. Collectively, 2025 exit activity represented an improvement from prior years, underscoring a continued normalization of liquidity conditions despite a still selective exit market.
EUROPEAN PRIVATE EQUITY
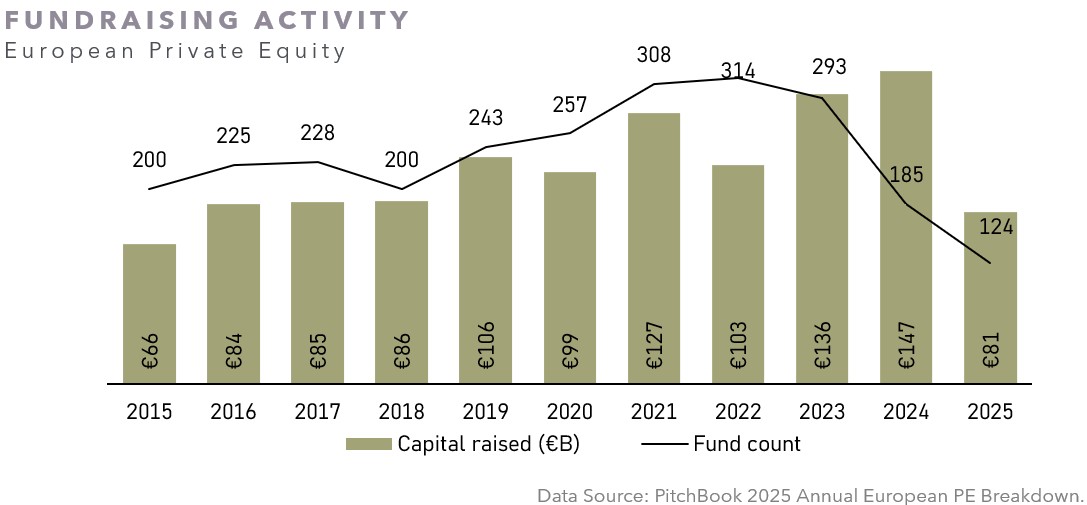
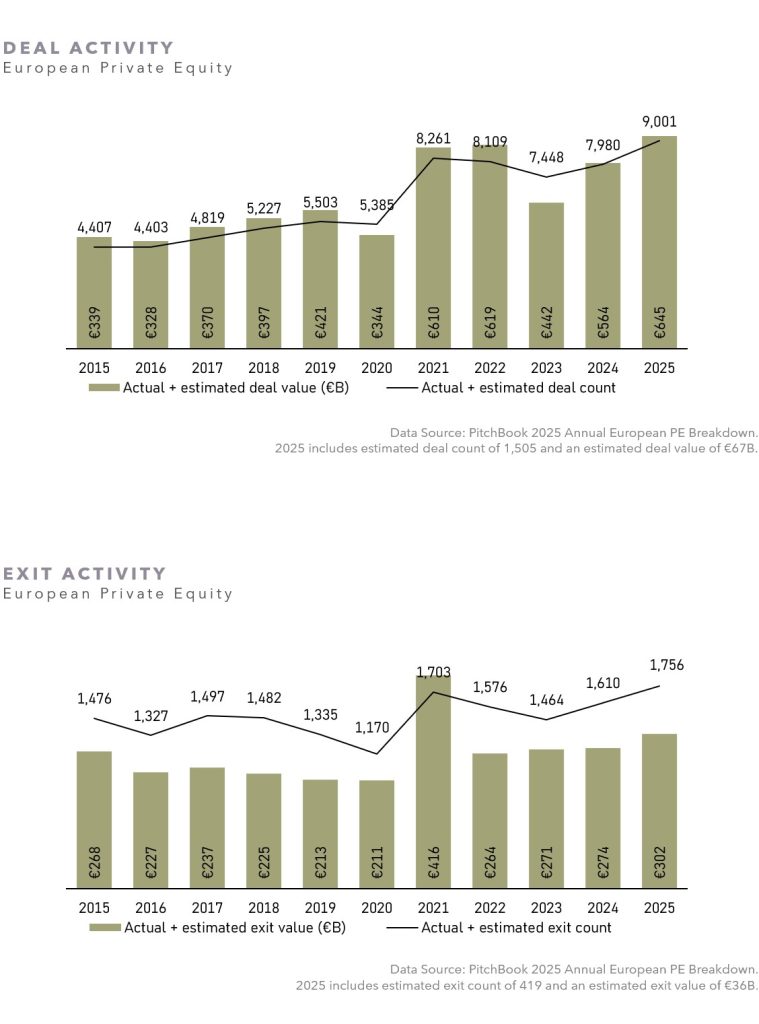
European private equity fundraising in 2025 slowed significantly compared to a record year in 2024. Fundraising in 2025 represented the lowest level of fundraising, at €81 billion, since 2015. The number of funds raised came in at the lowest level in the last 10 years with 124 funds closing, compared to 185 in 2024. These declines are in part driven by a lack of European large cap managers raising in this period. A bright spot is the middle-market, which raised a record €80 billion, compared to €70 billion in 2024. The rise of the middle-market is a trend that began in 2022, with year-over-year volume increases every year over the last four years. This rising trend may be due to both the availability of acquisition targets and perceived optionality regarding exit routes (outside of IPO and sale to strategics), with many large cap PE groups having plenty of dry powder available from prior fund raises.
Deal activity in 2025 stood in stark contrast to the muted fundraising environment. Activity reached a record in 2025 with 9,001 deals worth an estimated €645 billion closing (includes an estimated deal count of 1,505 and deal value of €67 billion). This marked year-over-year increases in deal count and value compared to 2024 of 13% and 14%, respectively. Monetary easing continued to gain momentum in Europe with the European Central Bank cutting rates four times in 2025. With inflation moving closer to target levels, further rate cuts in 2026 could be on the horizon and may support continued strong levels of deal activity.
With respect to realizations, activity continued its upward trend in 2025 compared to the prior two years. In 2025, 1,756 PE-backed companies exited, a 9% increase year over year (2025 includes an estimated exit count of 419). Exit volume also continued its upward trajectory with a cumulative value of €302 billion in exits, representing a year-over-year increase of 10% in exit value compared to 2024 (2025 includes an estimated exit value of €36 billion). Despite this continued increase, exit numbers and volumes remained significantly below the levels seen in 2021, but they could point toward a slow return to normality.
SECONDARIES
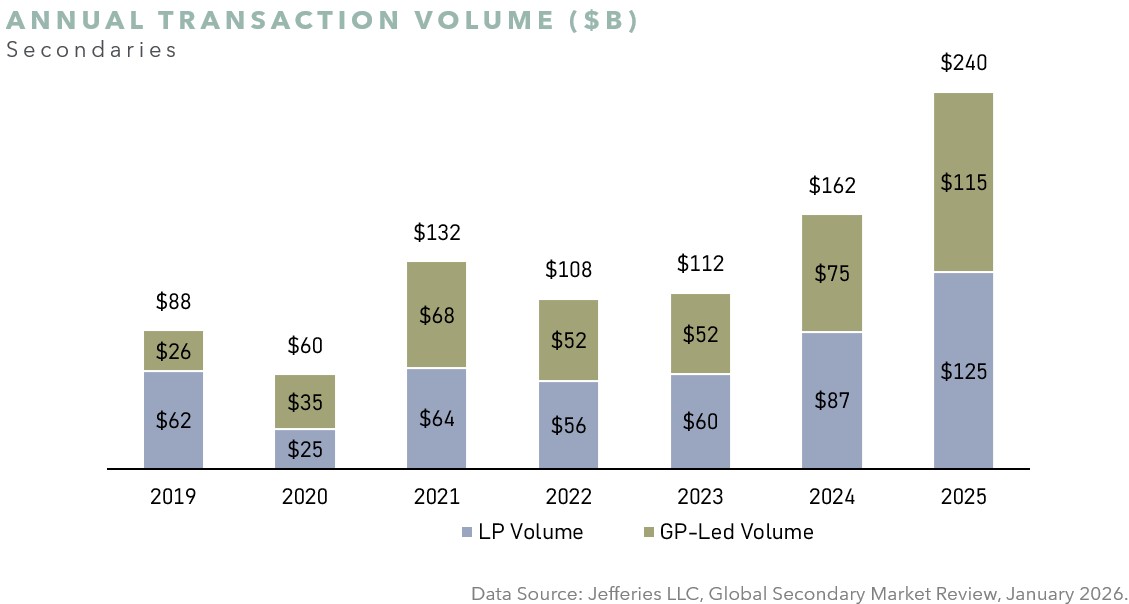
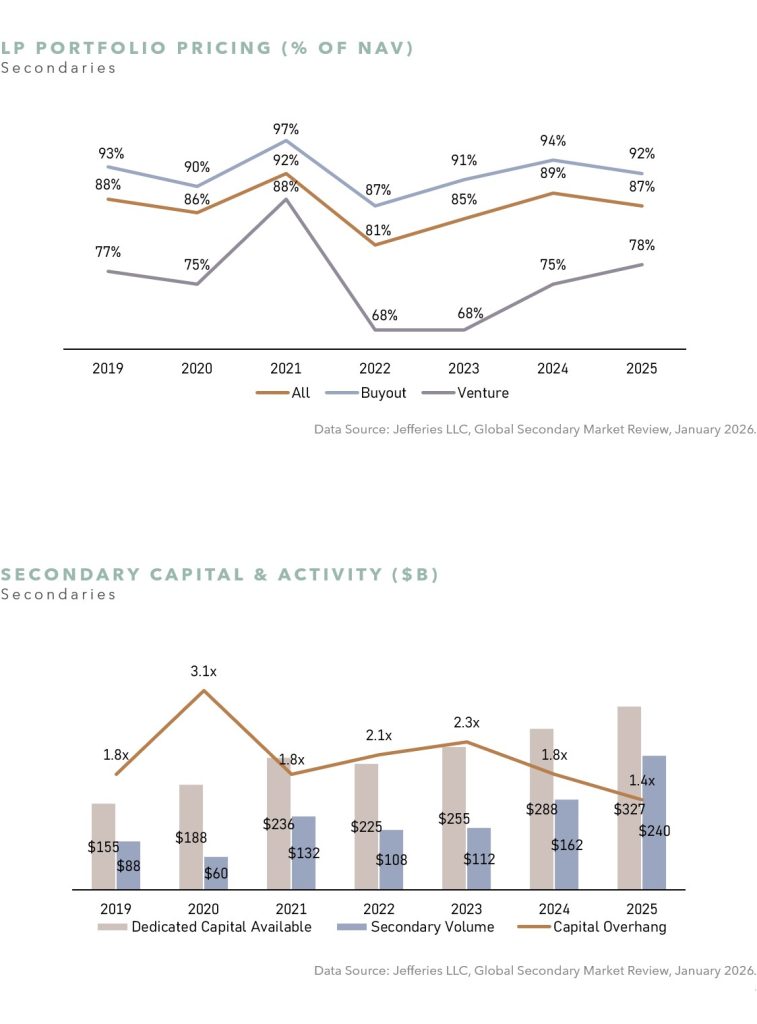
The global secondary market set fresh records in 2025, with volumes increasing by 48% year over year to $240 billion. This was driven by strong increases in both GP-led and LP transaction volume, with the majority of transactions being LP. On the LP side, Jefferies noted that growth was driven by a strong supply of LP portfolio sales, catalyzed by a need for accelerated liquidity and active portfolio management, which was met with a highly capitalized secondary buyer base. First-time sellers represented 40% of transaction volume, highlighting the growth of new participants in the secondary market. As in years past, the number of large LP sales (greater than $1 billion) continued to play a large role in the market, representing 43% of total volume. Pension and sovereign wealth funds accounted for the largest portion of sellers, at 34% of LP transaction volume, though funds-of-funds were also active during the year at 15% of total volume.
GP-led deals had another record year in 2025, increasing by 53% year over year to $115 billion. The second half of 2025 was particularly active, with $68 billion of GP-led volume, which nearly equaled the entire 2024 full-year volume of $75 billion. The vast majority of GP-led transactions continued to be continuation vehicles (CVs), with the remaining minority of deals coming from tender offers, structured equity, and fund finance transactions. The GP-led market continues to grow as sponsors leverage CVs as a legitimate exit path, even as traditional exit markets began to open up in the second half of 2025. Jefferies noted that the adoption of CV technology is significant, with 80% of the top 100 sponsors by AUM having conducted a CV during or prior to 2025. As in years past, single asset CVs represented the largest percentage of GP-led deals in 2025 (53%), while 70% of all GP-led deals were in buyout strategies.
Pricing for all LP-led deals declined slightly in 2025, driven by a minor decline in buyout pricing and partially offset by an increase in venture pricing. On the buyout side, pricing averaged 92% of NAV, representing a 200 basis point decline compared to 2024. According to Jefferies, this modest softening was driven by an older vintage year mix. In 2025, the average vintage year of buyout funds sold was 2016, versus the prior year, when the average vintage year of funds sold was 2018. Similar to 2024, buyout portfolios represented 70% of all selling volume. On the venture side, pricing increased to 78% of NAV, up 300 basis points from the prior year. This was likely driven by a perceived stabilization in the venture market, especially in the AI sector, and increased demand from venture specialists and other multi-strategy investors.
In 2025 closed-end secondary fundraising represented 18% of the total private capital raised, up from 7% in the prior year, reflecting a growing popularity of allocation to secondary strategies. Furthermore, three of the ten largest private equity fundraises of 2025 were for closed-end secondary strategies, including the largest fund raise of the year (as per Jefferies).
OUTLOOK
Some of the observations around dealmaking momentum made in our year-end 2024 letter appear to have borne out, as was our comment about the inherent difficulty in predictions. The recovery in deployment and monetization volumes culminated in full-year 2025 totals that were the second-best on record. However, the uneven way in which these heady figures were achieved may temper sentiment throughout 2026. Toward the end of 2026’s first quarter, cautious optimism and persistent uncertainty are having to co-exist. As of late-February 2026, U.S. public equity indices were flat. Publicly and privately held companies are grappling with the perennial evolution of U.S. trade policy and implications of AI upon existing business models, among other considerations. While it is probably premature to forecast this technology’s ultimate winners and losers, AI likely represents a tectonic economic and financial shift similar in magnitude to that of the Internet’s advent. AI is not just top of mind for venture investors in 2026, but also for the wider swath of more established businesses such as traditional software-as-a-service (“SaaS”), insurance brokerage, etc.
Investors in private equity and venture capital can anticipate upcoming investment activity to be supported by ample dry powder and accommodative monetary policy. We also expect that 2026’s fundraising successes will be enjoyed by managers who are able to navigate the above crosscurrents through a reemphasis on some of the asset class’s fundamentals: operational value-add, liquidity management, and measured deployment of LPs’ capital.
ADDITIONAL CHARTS
SOURCES AND IMPORTANT INFORMATION
SOURCES
Unless otherwise noted, with respect to private equity information, data sourced through: PitchBook 2025 Annual US PE Breakdown and PitchBook 2025 Annual European PE Breakdown.
Unless otherwise noted, with respect to venture capital information, data sourced through: Q4 2025 PitchBook-NVCA Venture Monitor.
Unless otherwise noted, with respect to secondaries information, data sourced through: Jefferies Global Secondary Market Review, January 2026.
IMPORTANT INFORMATION
Past performance is not a guide to future results and is not indicative of expected realized returns.
The views and information provided are as of March 2026 unless otherwise indicated and are subject to frequent change, update, revision, verification and amendment, materially or otherwise, without notice, as market or other conditions change. There can be no assurance that terms and trends described herein will continue or that forecasts are accurate. Certain statements contained herein are statements of future expectations or forward-looking statements that are based on Abbott’s views and assumptions as of the date hereof and involve known and unknown risks and uncertainties (including those discussed below and in Abbott’s Form ADV Part 2A, available on the SEC’s website at www.adviserinfo.sec.gov) that could cause actual results, performance or events to differ materially and adversely from what has been expressed or implied in such statements. Forward-looking statements may be identified by context or words such as “may, will, should, expects, plans, intends, anticipates, believes, estimates, predicts, potential or continue” and other similar expressions. Neither Abbott, its affiliates, nor any of Abbott’s or its affiliates’ respective advisers, members, directors, officers, partners, agents, representatives or employees or any other person is under any obligation to update or keep current the information contained in this document.
This material is for informational purposes only and is not an offer or a solicitation to subscribe to any fund and does not constitute investment, legal, regulatory, business, tax, financial, accounting or other advice or a recommendation regarding any securities of Abbott, of any fund or vehicle managed by Abbott, or of any other issuer of securities. No representation or warranty, express or implied, is given as to the accuracy, fairness, correctness or completeness of third party sourced data or opinions contained herein and no liability (in negligence or otherwise) is accepted by Abbott for any loss howsoever arising, directly or indirectly, from any use of this document or its contents, or otherwise arising in connection with the provision of such third-party data.